�ճ����ConnectIN project was a two-year pilot project evaluating the internet connectivity in First Nations communities in BC, Alberta and Manitoba. Led by three First Nations’ regional technology organizations, and facilitated by ֪����Ƶ, the goal of this project was to better assess gaps in infrastructure and services. ConnectIN wrapped up in February 2020. In this post, we present the high-level results.
Recent global events are reminding us, once again, of the importance of a reliable internet connection. While many Canadians are now learning this first-hand as they attempt to work or learn from home, people in rural and remote communities, including First Nations, have been grappling with little-to-no connectivity for years.
in 2018, 30 years after commercial internet was first introduced to Canada, many rural and remote regions of the country remain woefully lacking in universal broadband connectivity. And while there are a number of government and private funds available for rural communities and to improve their bandwidth access, the requirements to apply for those funds can be frustratingly prohibitive.
The Problem
The largest of the connectivity funds, the , has $750 million available to support projects that provide fixed and mobile wireless broadband internet access services to “eligible underserved areas of Canada”. To qualify as “underserved,” you need to live in an area that the CRTC has identified as being underserved, or you need to provide data *proving* that the internet speeds in your community are less than 50 Mbps download / 10 Mbps upload.

The problems with this system are multifold: the areas identified by the CRTC as having “adequate” or “inadequate” connectivity are mapped in hexagonal zones 25 km in radius. If only one household in that 25 km zone has sufficient internet access, the entire region is identified as being “adequately served,” no matter the connectivity of everyone else (see diagram, left).
The second issue is that many of the online internet speed testing services, which are used to determine individual’s and organization’s internet speed capabilities, require a minimum achievable speed before they can even conduct the test. So if the internet achieved falls below that minimum speed, those sites cannot determine what the actual speed is. Put differently, in some places the internet is so slow that available speed testing tools do not even work. This means many communities *cannot even collect data* to bring to the government to prove they are below the 50 Mbps up / 10 Mbps down threshold.
And on top of that, First Nations communities face an additional roadblock in testing their internet speed. Many of these communities do not use the postal code system (which the speed testing sites also require). So, even if their internet is fast enough to use available speed tests, First Nations communities still can’t get data that is correlated to their actual location.
DIY internet speed testing
In 2018, the , the , and the — along with and technology advisor Bill Murdoch — teamed up with ֪����Ƶ to find a new way to test the internet speeds available in First Nations communities. With funding from the (CIRA) through its Community Investment Program, the ConnectIN team configured inexpensive devices (called Banana Pis) that were installed in the public buildings of 20+ participating communities in order to test their internet speeds.
The devices collected data on the upload, download, and latency speeds achieved in each community. (To ensure privacy, no IP addresses or internet content information was collected — just data on speed).
The results


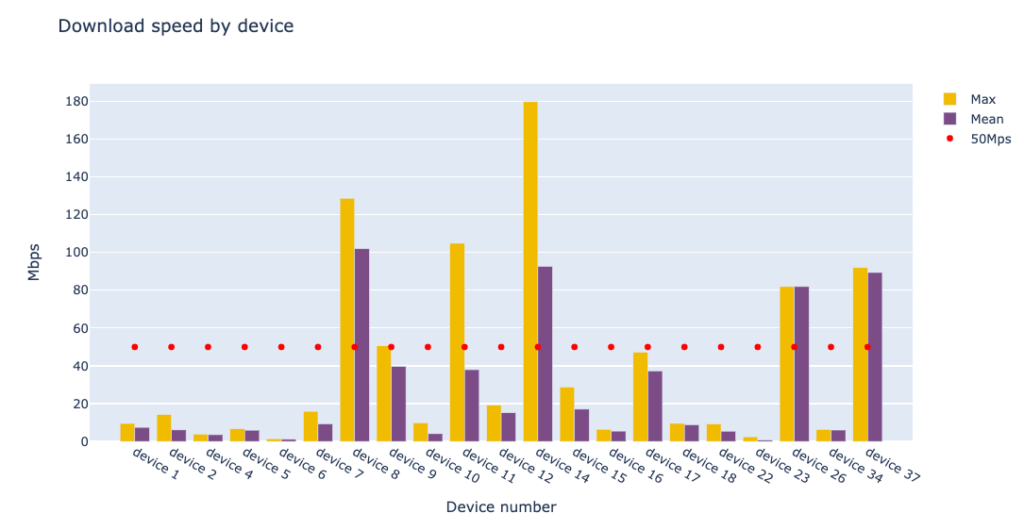
Of the 20+ communities tested:
- Only nine (43%) achieved average upload speeds greater than the CRTC minimum of 10 Mbps
- Only five (24%) achieved average download speeds greater than the CRTC minimum of 50 Mbps
- Availability fluctuated at different points in the day. Several of the communities that technically “met” the CRTC upload/download standards only did so, on average, during the hours between 4:00-5:00 am. (See the diagram below for a breakdown of one such community)
- Just over 50% of communities fell below the minimum speed targets of 10 Mbps up / 50 Mbps down

What’s next?
The communities that participated in the ConnectIN project now have conclusive data showing the actual internet speeds they are achieving, which should provide many of them with a good case for infrastructure funding.
However, the goal of this project was much wider than helping this select group of communities. We want to empower rural communities across Canada to collect and analyse their own internet speed data. To that end, the configuration that we used to set up the Banana Pis to conduct these tests have been .
֪����Ƶ has also developed a free through which communities can load the data collected from their Banana Pis, and assess the results.
Our hope for this project was to find a better way to identify network gaps through a community-led effort. We believe that, through concrete data, communities can best make the case for appropriate infrastructure support and, in turn, influence future regulations on broadband accessibility and funding programs.
To find out how to run your own community internet assessment project, contact: projects@cybera.ca.

